Use the Slog WordPress plugins to analyse daily trace summary reports.
Making use of oik-bwtrace’s daily trace summary reports, Slog provides reports to see what your site’s been doing.

The Slog plugin is a generic solution to enable performance analysis and comparison of server responses with different server configurations.
Settings > Slog Admin tabs
| Tab | Purpose |
|---|---|
| Reports | Use this tab to produce a variety of reports for a single daily trace summary file. |
| Compare | Produce comparison charts for two or more trace summary files. |
| Download | Download a daily trace summary file from a remote host site. |
| Filter | Filter a daily trace summary file. |
| Driver | Run the same request multiple times from the browser |
| Search | Search trace files for a specific string |
| Settings | Define default/initial settings for the reports. |
Reports
Use Reports to view the daily trace output grouped and summarised in a variety of ways.
| Report type | Displays |
|---|---|
| Request types | Requests by type – to see how the site’s being used |
| Stripped request URIs | Groups requests by the URI, excluding query parameters |
| Stripped request URIs top level | Groups requests by the first part of the permalink |
| Hook counts | Groups requests by the number of hooks run – Experimental |
| Remote IP | Requests by IP – helps you to detect spammers |
| Elapsed | Requests grouped by elapsed server time. |
Choose the Chart Type and Display to visualise the results.
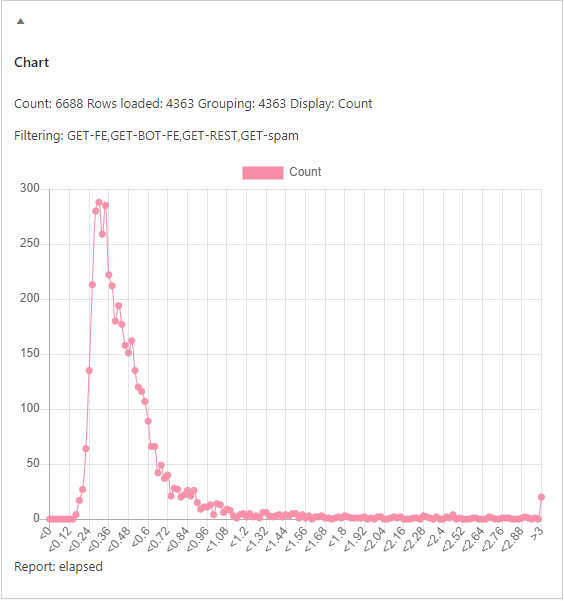
Chart types are: Line, Bar, Horizontal bar and Pie.
Display options are:
- Count
- Elapsed
- Average
- Percentage count
- Percentage elapsed
- Accumulated count percentage
- Accumulated count elapsed
The summary data is also shown in a table with columns for each of the Display options.
Analysis you might want to perform:
- Server performance – Percentage satisfied by time
- Server performance – Accumuative percentage satisfied by time.
Note: You’ll need the sb-chart-block plugin to visualise the data in a chart.
Compare
Compares the output up to 15 daily trace summary downloads / filtered files.
Use the Compare tab to visualise the effect of activating / deactivating a plugin, theme, widget or configuration option on server side performance.
Requires sb-chart-block.
Download
Use the Download tab to download a daily trace summary file.
This will only work if the file is accessible to any browser. If the file is protected from general access, returning a 403 or otherwise, then you’ll need to download the file by another mechanism. eg FTP or from your site’s control panel.
Filter
The purpose of Filtering is to reduce a daily trace summary file to a subset of requests that allow better comparison of multiple files.
Examples:
- Reasonable responses < x.y secs
- Only GET requests performed on the front-end ( FE ) by real users, not bots ( BOT ).
- Only requests which resulted in a 200( OK ) HTTP response code.
Driver
Use the Driver tab to run the same request from the browser multiple times. Use this when running tests to compare the server side performance of the request with different configurations.
Search
Use the Search to look for a particular string in a trace file and/or daily trace summary file.
Settings
Use the Settings tab to define default values to be used in the other forms.
Required plugins
- Slog uses the output from the oik-bwtrace plugin’s daily trace summary reports.
- To be able to view the charts you will need the sb-chart-block plugin.
